Web
HR portal landing page
The Human Resource portal sign-in page in Peruri's visual identity.
Case study · 05 / 08
Making dense HR operations information easier to read.
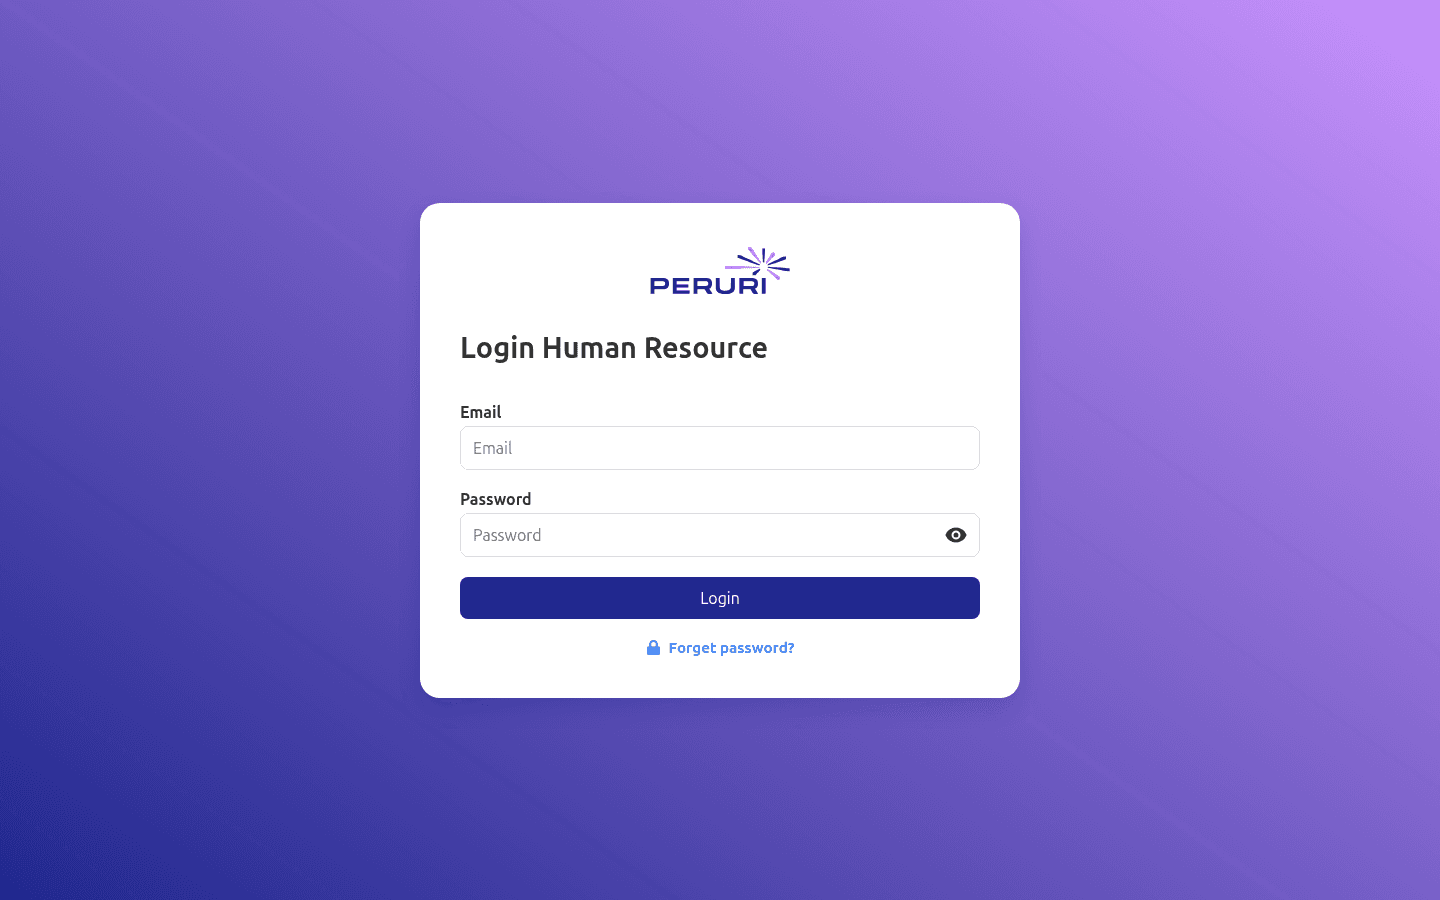
The front-end of Perum Peruri's HR portal—a login landing page plus Employee Facilities, Cost Monitoring, and Workforce Strength dashboards—together with Human Resource Operations modules built from modular pages, reusable components, structured SCSS, and a Gulp build pipeline.
Key achievement
Turned HR reporting needs into a portal with three dashboards and consistent operational modules.
01 · Context
Primary users
The problem
Workforce, facilities, cost, and employee-composition information becomes difficult to scan when distributed across dense tables and indicators.
The approach
The interface uses modular pages, KPI hierarchy, filters, charts, tables, navigation, and reusable partials to maintain a consistent visual pattern.
Key numbers
02 · My role
Front-end & Data Support
Technology used
Built the HR portal's login landing page in Peruri's visual identity.
Built the Employee Facilities, Cost Monitoring, and Workforce Strength dashboards, linked through tabs.
Split operational pages into modules and reusable partials such as the header, sidebar, cards, tables, and filters.
Organized structured SCSS compiled through Gulp for a repeatable front-end workflow.
03 · Highlights
Click an image to view it larger.
Swipe through them all, tap an image to enlarge it.
01 / 04
The Human Resource portal sign-in page in Peruri's visual identity.
Electricity, phone credit, water, and loan totals with usage charts per position.
Employee composition by contract status in a table and pie chart.
Budget realisation, percentage spent, and monthly spending trend.
04 · Challenges & decisions
01 / 02
05 · Outcome
The showcase demonstrates translating internal reporting needs into a structured dashboard supported by a repeatable front-end workflow.
User flow
Architecture
Pages
Independent pages for different operational contexts
Partials
Header · sidebar · cards · filters · tables
Styling
Structured SCSS · responsive layout · visual consistency
Build
Gulp compilation and minification for front-end delivery